You will view the results of your analysis by drawing a contour plot of the deformed model. You will then use display groups to display one of the hinge pieces; by displaying just a portion of the model you can view results that are not visible when you display the whole model.
In this section you will display a contour plot of the model and adjust the deformation scale factor.
To display a contour plot of the model:
From the main menu bar, select Plot![]() Contours
Contours![]() On Deformed Shape.
On Deformed Shape.
Abaqus/CAE displays a contour plot of von Mises stress superimposed on the deformed shape of the model at the end of the last increment of the loading step, as indicated by the following text in the state block:
Step: Load, Apply load
Increment     6: Step Time =   1.000
By default, all surfaces with no results (in this case, the pin) are displayed in white.
The deformation is exaggerated because of the default deformation scale factor that Abaqus/CAE selects.
To remove the white surfaces from the display, do the following:
In the Results Tree, expand the Surface Sets container underneath the output database file named PullHinge.odb.
Select all the surfaces that appear in the list.
Click mouse button 3, and select Remove from the menu that appears.
The white surfaces disappear from the view.
To reduce the deformation scale factor, do the following:
From the main menu bar, select Options![]() Common.
Common.
The Common Plot Options dialog box appears.
From the Deformation Scale Factor options, choose Uniform.
In the Value text field, type a value of 100; and click OK.
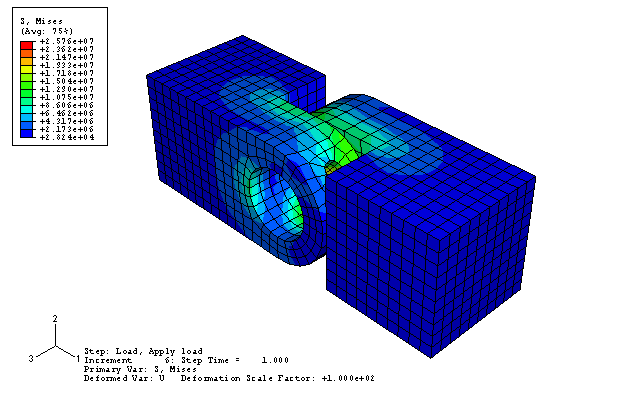
Abaqus/CAE displays the contour plot with a deformation scale factor of 100, as shown in Figure C53.
Use the view manipulation tools to examine the deformed model. Note where the pin appears to be exerting the most pressure against the insides of the flanges. Also note how the two flanges have twisted away from each other.
By default, the contour plot displays the von Mises stresses in the model; you can view other variables by selecting them from the Field Output toolbar. Select S11 from the list of components and invariants on the right side of the Field Output toolbar.
Abaqus/CAE replaces the default von Mises plot with a contour plot of the stresses in the 1-direction.
Select Max. Principal from the list of components and invariants to see the maximum principal stresses on the model.
Select any other variables of interest from the Field Output toolbar.
Click the ![]() tool in the toolbar to display the Field Output dialog box. On the Primary Variable tab, select S as the output variable, select Mises as the invariant, and click OK to display the von Mises stresses again and to close the dialog box.
tool in the toolbar to display the Field Output dialog box. On the Primary Variable tab, select S as the output variable, select Mises as the invariant, and click OK to display the von Mises stresses again and to close the dialog box.
The Field Output dialog box offers some controls and access to other dialog boxes, such as the Section Points dialog box, that cannot be accessed from the Field Output toolbar.
You will now create a display group that includes only the element sets that make up the hinge piece that includes the lubrication hole. By removing all other element sets from the display, you will be able to view results for the surface of the flange that contacts the other hinge.
To create the display group:
In the Results Tree, expand the Instances container underneath the output database named PullHinge.odb.
From the list of available part instances, select HINGE-HOLE-1. Click mouse button 3, and select Replace from the menu that appears to replace the current display group with the selected elements. Click ![]() , if necessary, to fit the model in the viewport.
, if necessary, to fit the model in the viewport.
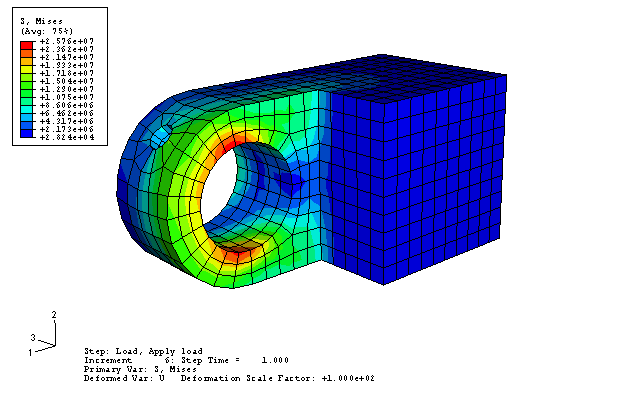
The contour plot of the entire model is replaced by a plot of only the selected hinge piece, as shown in Figure C54.
Use the view manipulation tools to view the hinge at different angles. You can now see results for surfaces on the hinge that were hidden by the solid hinge.
From the main menu bar, select Result![]() Field Output.
Field Output.
From the top of the Primary Variable tabbed page, toggle on List only variables with results: and choose at surface nodes from the menu.
From the list of variables that appears, select CPRESS, and click Apply.
Abaqus/CAE displays a contour plot of the contact pressures in the flange hole.
For more information about using the Visualization module, see the following sections:
You have now completed this tutorial and learned how to:
create and modify features;
use datum geometry to add features to a model;
use position constraints to assemble a model composed of more than one part;
define contact interactions between regions of a model;
monitor the progress of an analysis job; and
use display groups to view results for individual parts of a model.