Product: Abaqus/CAE
Benefits: You can now probe a model plot for all of the direct components of a tensor variable or for all of the principal components of a vector variable, rather than for just the selected component. In addition, you can now specify multiple labels at the same time when you add nodes or elements to a query by their labels, you can probe a model plot for nodes or elements from a particular display group, and you can annotate an individual node or element in the viewport with its field output results. These enhancements improve usability and offer more customization options for probing values in a model.
Description: The probe functionality includes the following enhancements:
You can now launch the Probe Values dialog box more quickly by clicking the new ![]() button in the Visualization module toolbox.
button in the Visualization module toolbox.
The Probe Values dialog box now enables you to display all of the component values for a tensor or vector variable and to write these values to a file.
For tensor quantities you can query for the selected invariant or component for all six direct components of the tensor or for all three principal components of the tensor. For vector variables you can query for either the resultant vector value or for one of the individual component values.
When you add nodes or elements to a probe by keying in their IDs, Abaqus/CAE now enables you to specify a list of comma-separated IDs at the same time.
You can now probe values from all the nodes or elements in a particular display group. If you choose Select a display group and specify one of the display groups in your session, Abaqus/CAE adds rows to the data table for all the nodes or elements in that display group.
You can create a new display group using the group of nodes or elements in the data table by clicking mouse button 3 in the data table and selecting Create Display Group.
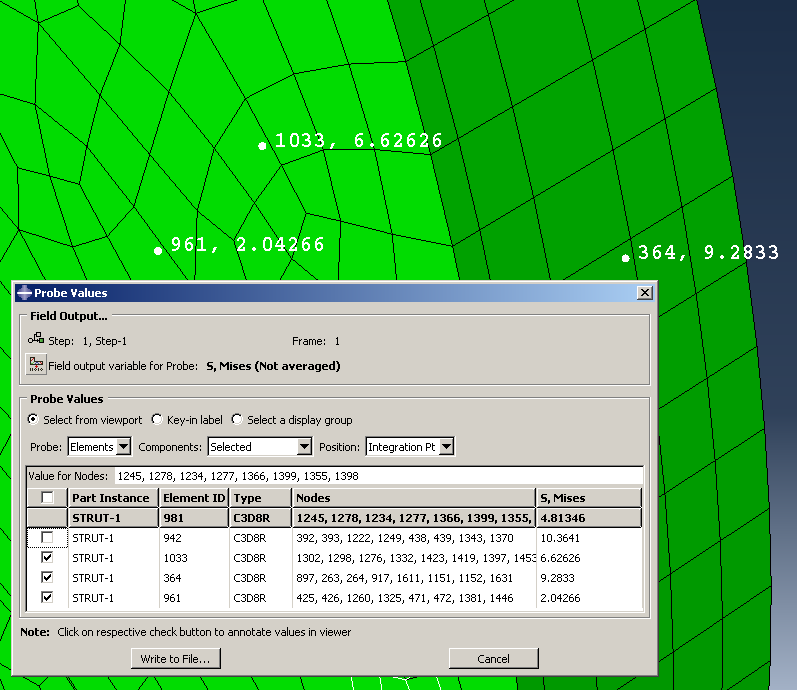
You can display the field output results for an individual node or element as annotations that appear next to the node or element in the viewport. Figure 134 shows a model with probe annotations that display the element label and Mises stress value for three of the four elements selected in the Probe Values dialog box.
Visualization module:

    Click  from the toolbox:
        Use the Select a display group option to probe values in a particular display group.
        From the Components list, select the component values that you want to probe.
        Toggle on check boxes in the left column of the data table to display probe annotations.
from the toolbox:
Use the Select a display group option to probe values in a particular display group.
From the Components list, select the component values that you want to probe.
Toggle on check boxes in the left column of the data table to display probe annotations.