Product: Abaqus/CAE
Benefits: You can now read X–Y data from the active free body definitions in your session. This enhancement enables you to display the resultant force or moment data from locations in your model in an X–Y plot or in a table.
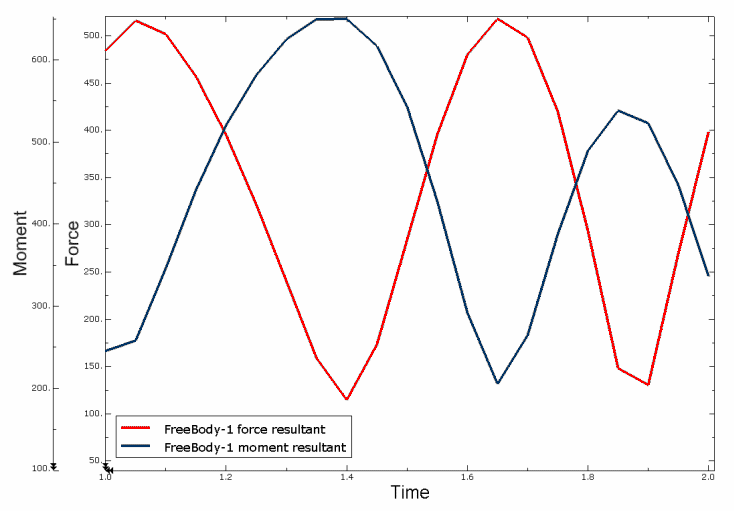
Description: You can now extract the resultant force and moment data from the active free body cuts in your session as new X–Y data objects. Figure 138 shows an X–Y plot of the resultant force and moment data for two different free body cut definitions.
Abaqus/CAE reads X–Y data from all free body cuts listed as active in the Free Body Cut Manager and creates individual X–Y data objects for the free body entities and components that you select. You can create X–Y data objects from the force data, moment data, or both entities in free body cuts; and you can create X–Y data objects from the resultant magnitude and from any of its three component values. Selecting all of these options prompts Abaqus/CAE to create eight X–Y data objects for each active free body cut in your session.
Visualization module:
Tools XY DataCreate: Free body