Product: Abaqus/Explicit
The model consists of a bar through which a one-dimensional wave is propagated. The bar is given an initial rigid body velocity of 57.14 m/sec in the positive x-direction. The analysis is run in two steps. In the first step a hat-shaped velocity pulse is defined at the left end of the bar, and a wave form is generated. In the second step the velocity at the left end of the bar is held constant at 57.14 m/sec, and the wave propagates through the bar. The wavelength of the pulse is chosen to be relatively short (over about 10 elements) for a more severe test of the advection algorithms applied to wave propagation. Problems with wavelengths that span large numbers of elements are not as difficult because overall diffusion and dispersion effects are less pronounced.
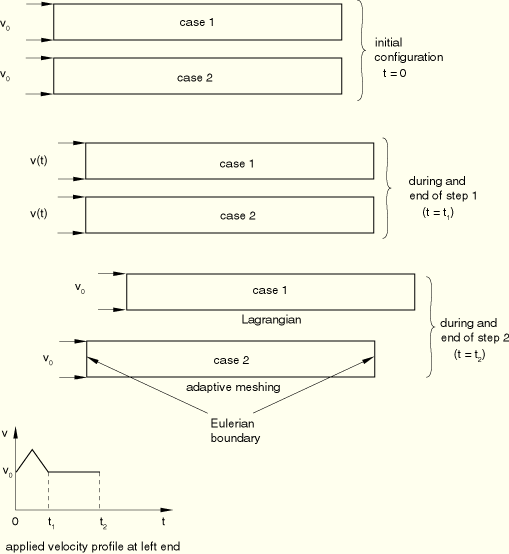
Two different techniques are used to solve the problem and are shown schematically in Figure 1.12.2–1.
Both steps are run as a pure Lagrangian analysis.
The first step is run as a pure Lagrangian analysis to generate the wave form. The second step is run in an Eulerian fashion by defining an adaptive mesh domain that incorporates the bar. Eulerian boundaries are defined at either end of the bar. Adaptive mesh constraints are used to hold the mesh in place at both the inflow and outflow boundaries. The mesh is held stationary on the interior of the domain by using the MESHING PREDICTOR=PREVIOUS setting on the *ADAPTIVE MESH CONTROLS option (the default for Eulerian adaptive mesh domains). The mesh is pulled back to its position after the last adaptive mesh increment, which has the effect of holding the mesh stationary for a uniform mesh with no boundary deformation. The MOMENTUM ADVECTION parameter on the *ADAPTIVE MESH CONTROLS option is changed from the default value, ELEMENT CENTER PROJECTION, to HALF INDEX SHIFT because a more accurate momentum advection technique is desirable for wave propagation problems such as these. Although the differences in the two methods are very slight for this problem, the half-index shift is expected to lead to marginally better dispersion characteristics than the element center projection.
Three different geometric models with three different material behaviors for each model are analyzed for both cases. In the two-dimensional, plane strain model the bar measures 27.6 m in length by 0.575 m in width. In the axisymmetric model the bar measures 27.6 m axially (length direction) by 0.575 m radially. In the three-dimensional model the bar measures 27.6 m in length, .575 m in width, and 5 m in depth. For all models the wave is propagated through the bar in the length direction.
The material models used in each analysis include an equation of state having the properties of water, a Mooney-Rivlin hyperelastic material having the properties of rubber, and a von Mises elastic-plastic material having the properties of steel. The parameters and constants used for each material model can be found in the input files that are included with the Abaqus release. The maximum velocities of the wave pulse in the water, the rubber, and the steel are 492, 28, and 250 m/sec (Mach 0.3, 0.12, and 0.035), respectively. These velocities are typical for shock waves traveling through each type of material.
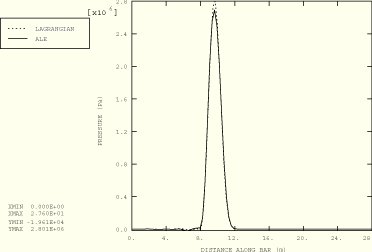
Path plots of the pressure along the length of the bar at three equivalent points in time (![]() <
< ![]() <
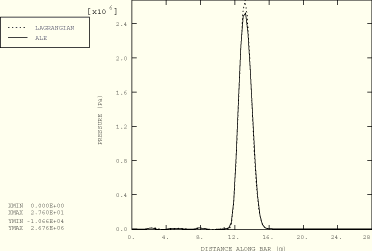
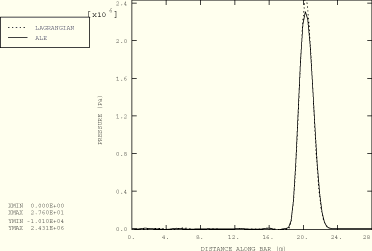
< ![]() ) are compared for both cases using the equation of state model in Figure 1.12.2–2, Figure 1.12.2–3, and Figure 1.12.2–4. The results are in good agreement, considering the fact that the wave is a strong shock (Mach = 0.3). The adaptive meshing solution predicts slightly smaller peak values; however, the width of the pulse exactly matches the Lagrangian solution and no erroneous phase shifts are introduced. Figure 1.12.2–5, Figure 1.12.2–6, and Figure 1.12.2–7 show path plots at three different times for the Mooney-Rivlin hyperelastic material. In this case the wave has a Mach number of 0.12. Again, the pure Lagrangian and adaptive meshing results are in good agreement. The peak values predicted by the adaptive meshing technique for this material are in closer agreement with the pure Lagrangian solution than those predicted for the equation of state material because of the weaker shock wave. Strong shocks are extremely sensitive to any flux limiting introduced during material transport; while the algorithms used are designed to prevent significant diffusion, some inaccuracies are to be expected.
) are compared for both cases using the equation of state model in Figure 1.12.2–2, Figure 1.12.2–3, and Figure 1.12.2–4. The results are in good agreement, considering the fact that the wave is a strong shock (Mach = 0.3). The adaptive meshing solution predicts slightly smaller peak values; however, the width of the pulse exactly matches the Lagrangian solution and no erroneous phase shifts are introduced. Figure 1.12.2–5, Figure 1.12.2–6, and Figure 1.12.2–7 show path plots at three different times for the Mooney-Rivlin hyperelastic material. In this case the wave has a Mach number of 0.12. Again, the pure Lagrangian and adaptive meshing results are in good agreement. The peak values predicted by the adaptive meshing technique for this material are in closer agreement with the pure Lagrangian solution than those predicted for the equation of state material because of the weaker shock wave. Strong shocks are extremely sensitive to any flux limiting introduced during material transport; while the algorithms used are designed to prevent significant diffusion, some inaccuracies are to be expected.
Three-dimensional model with the EOS material.
Three-dimensional model with Mises plasticity.
Three-dimensional model with hyperelasticity.
Plane strain model with the EOS material.
Plane strain model with Mises plasticity.
Plane strain model with hyperelasticity.
Axisymmetric model with the EOS material.
Axisymmetric model with Mises plasticity.
Axisymmetric model with hyperelasticity.
Figure 1.12.2–2 Path plot of pressure at 45% of the total travel time for Cases 1 and 2 (EOS material).
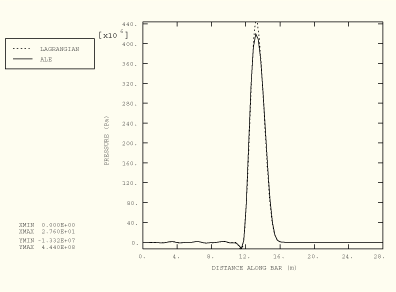
Figure 1.12.2–3 Path plot of pressure at 67% of the total travel time for Cases 1 and 2 (EOS material).
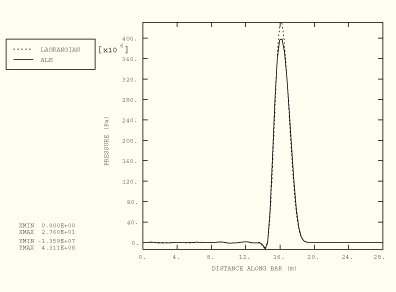
Figure 1.12.2–4 Path plot of pressure at 90% of the total travel time for Cases 1 and 2 (EOS material).
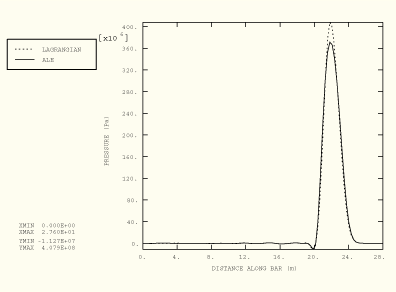
Figure 1.12.2–5 Path plot of pressure at 44% of the total travel time for Cases 1 and 2 (Mooney-Rivlin).