Product: Abaqus/Explicit
This example demonstrates the following Abaqus/Explicit features and techniques:
applying CONWEP blast loading,
comparing computational results using Abaqus/Explicit and experimental measurements of deformation of sandwich structures under blast loads, and
demonstrating a generic example of a nonlinear analysis of a sandwich structure.
Modern structural designs can be used to protect various systems that are vulnerable to large blast loads. Sandwich structures are a particular class of modern structures that could be explored for such applications. Dynamic analysis with blast loading using Abaqus/Explicit provides an important analysis tool that can help engineers and designers build better structures to resist blast loads.
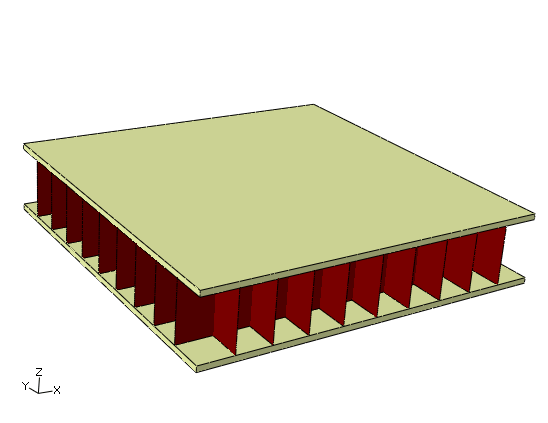
Two models are used in this example. One model is the sandwich plate structure described by Dharmasena et al. (2008) and shown in Figure 8.1.8–1. The sandwich structure consists of a square honeycomb core with vertical webs welded to top and bottom plates. The dimensions of the overall sandwich plate structure are 610 × 610 × 61 mm. The sandwich structure lies in the X–Y plane, while the blast source is 100 mm vertically above (along the z-direction) the center of the top plate of the sandwich structure. The top and bottom plates are 5 mm thick, and the square honeycomb core webs are 0.76 mm thick. The spacing between the honeycomb webs is 30.5 mm measured from the midplane.
The second model is a solid plate, which was chosen for comparison with Dharmasena et al.
The top and bottom plates and honeycomb core of the sandwich structure and the solid plate are all made of a high ductility stainless steel alloy (Al-6XN) comprised of 49% Fe, 24% Ni, 21% Cr, and 6% Mo by weight as described by Nahshon et al. (2007).
This example demonstrates the usage of CONWEP blast loading using Abaqus/Explicit. This example was chosen based on experiments reported by Dharmasena et al. (2008) that discuss the deformation of a particular sandwich structure and an equivalent solid plate subjected to CONWEP blast loads due to 1, 2, and 3 kg of TNT. The solid plate with equivalent material is presented as a simple example. The solid plate is modeled using shell elements and three-dimensional continuum elements. Finally, the main problem of interest, the sandwich structure described by Dharmasena et al., is analyzed. A tonne-millimeter-second-Kelvin unit system was chosen for all simulations.
| Case 1 | Solid plate modeled with S4R shell elements under 1 kg TNT blast load. |
| Case 2 | Solid plate modeled with S4R shell elements under 2 kg TNT blast load. |
| Case 3 | Solid plate modeled with S4R shell elements under 3 kg TNT blast load. |
| Case 4 | Solid plate modeled with C3D8R continuum elements under 1 kg TNT blast load. |
| Case 5 | Solid plate modeled with C3D8R continuum elements under 2 kg TNT blast load. |
| Case 6 | Solid plate modeled with C3D8R continuum elements under 3 kg TNT blast load. |
| Case 7 | Sandwich structure under 1 kg TNT blast load. |
| Case 8 | Sandwich structure under 2 kg TNT blast load. |
| Case 9 | Sandwich structure under 3 kg TNT blast load. |
Dynamic analysis using Abaqus/Explicit is performed for all cases. Solutions are computed up to 1.5 milliseconds, where no further permanent deformation is observed for all load values.
The mechanical properties of the steel alloy as described in Nahshon et al. (2007) are specified as follows: Young's modulus of 1.61 × 10⁵ MPa, Poisson's ratio of 0.35, density of 7.85 × 10⁻⁹ metric tons/mm3, and coefficient of expansion of 452 × 106 Nmm/metric tons![]() K.
K.
A Johnson-Cook model is used to model the elastic-plastic behavior with the following coefficients and constants: ![]() 400 MPa,
400 MPa, ![]() 1500 MPa,
1500 MPa, ![]() 0.045,
0.045, ![]() 0.4,
0.4, ![]() 1.2, and
1.2, and ![]() 0.001 s–1. The transition temperature is 293 K, and the melting temperature is 1800 K.
0.001 s–1. The transition temperature is 293 K, and the melting temperature is 1800 K.
Symmetry behavior is assumed. Only one-quarter of the structure is modeled for all cases, with the center of the plate positioned at the origin of the X–Y plane. The boundaries at ![]() mm and
mm and ![]() mm are fixed for all degrees of motion (ENCASTRE). Symmetry conditions about the x-axis (XSYMM) are applied at the plane
mm are fixed for all degrees of motion (ENCASTRE). Symmetry conditions about the x-axis (XSYMM) are applied at the plane ![]() . Similarly, symmetry conditions about the y-axis (YSYMM) are applied at the plane
. Similarly, symmetry conditions about the y-axis (YSYMM) are applied at the plane ![]() .
.
The CONWEP blast load is applied on the top surface of the plate. The source of the blast is at a standoff distance of 100 mm vertically above the center of the top surface of the plate. The property of the blast load is specified using the incident wave interaction property and the CONWEP charge property at the model level and the incident wave interaction at the step level.
The center displacement after 1.5 milliseconds was monitored to compare each case with experimental results. Single and double precision job execution gave similar results for all cases.
The animation of the deformed plate over the entire time period of 1.5 milliseconds shows large deformations at the center. The plate stabilizes after a few oscillations. Comparison of the total work done history (ALLWK) and the total plastic dissipation history (ALLPD) indicates that most of the work done by the blast load is dissipated in plastic deformation.
The solid plate model is modeled with shell elements and is subjected to CONWEP blast loading using different charge masses.
The plate surface is discretized using 31 × 31 S4R elements with nine integration points through the thickness of each element.
All degrees of freedom including the rotational degrees of freedom are fixed at the ![]() and
and ![]() edges boundaries, where
edges boundaries, where ![]() mm. Symmetry boundary conditions (XSYMM) are applied at the
mm. Symmetry boundary conditions (XSYMM) are applied at the ![]() edge, and symmetry boundary conditions (YSYMM) are applied at the
edge, and symmetry boundary conditions (YSYMM) are applied at the ![]() edge.
edge.
The solid plate is modeled with three-dimensional continuum elements and is subjected to CONWEP blast loading using different charge masses.
The plate surface is discretized using 31 × 31 C3D8R elements with five layers of elements through the thickness of the plate.
All degrees of freedom including the rotational degrees of freedom are fixed at the ![]() and
and ![]() face boundaries, where
face boundaries, where ![]() mm. X-symmetry boundary conditions are applied at the
mm. X-symmetry boundary conditions are applied at the ![]() face, and Y-symmetry boundary conditions are applied at the
face, and Y-symmetry boundary conditions are applied at the ![]() face.
face.
1, 2, and 3 kg TNT loads are used in Cases 4, 5, and 6, respectively. The blast source is kept at a standoff distance of 100 mm from the top surface of the plate.
History output of the center deflection at the top and the bottom surfaces of the plate is requested at every increment.
Similar behavior using C3D8R elements was observed as that observed using S4R elements. The top surface center deflection and the bottom surface center deflection were quite close to each other. The mean of the two values was used to compare the midsection deflection of the solid plate.
The sandwich plate structure is modeled using three-dimensional continuum elements for the top and bottom plates and shell elements for the square honeycomb core and is subjected to CONWEP blast loading using different charge masses.
The plate surface is discretized using 31 × 31 C3D8R elements with five layers of elements through the thickness of the plate. The honeycomb core is meshed using 30 layers of S4R shell elements along the height of the core with five integration points through their thickness.
All degrees of freedom including the rotational degrees of freedom are fixed at the ![]() and
and ![]() face boundaries, where
face boundaries, where ![]() mm. X-symmetry boundary conditions are applied at the
mm. X-symmetry boundary conditions are applied at the ![]() face, and Y-symmetry boundary conditions are applied at the
face, and Y-symmetry boundary conditions are applied at the ![]() face.
face.
1, 2, and 3 kg TNT loads are used in Cases 7, 8, and 9, respectively. The blast source was kept at a standoff distance of 100 mm from the top surface of the plate.
The edges of the shell elements at the top and bottom of the core are attached to the inner surfaces of the top plate and the bottom plate, respectively, using tie constraints. The shell element edges form the node-based slave surface to the master plate surfaces. The tie constraint is defined without allowing any adjustments and using the node set of the edges to identify the nodes on the slave surface that will be tied to the master surface.
General contact is specified at the step level, including all exterior surface contact interactions.
History output of the center deflection at the top and the bottom surfaces of the plate is requested at every increment.
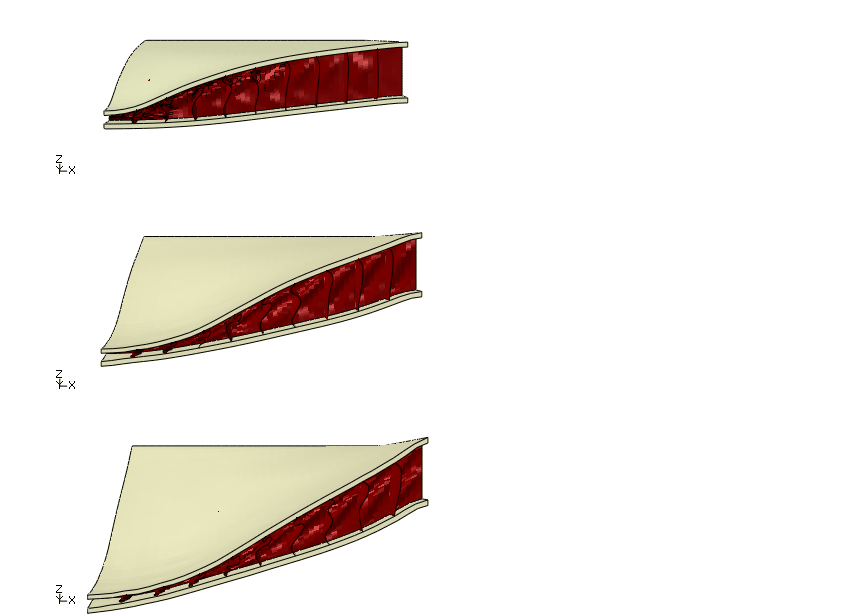
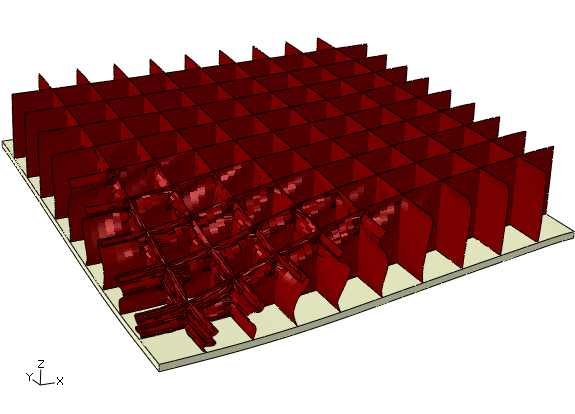
The analysis demonstrates significant buckling of the honeycomb webs involving self-contact near the center of the plate, as shown in Figure 8.1.8–2 for the three loading cases. Figure 8.1.8–3 shows the internal view for the 1 kg TNT blast charge case, revealing the deformation of the honeycomb core. It also confirms that tie constraints using node-based surfaces capture appropriately the weld between the webs and the inner surfaces of the plates.
Studies of similar structures using different parameters have been documented in the literature. Alternative material models and loading cases are mentioned here to provide examples for additional analyses. Different material models have been used to simulate the material behavior under such loads. The material model for the following atypical strain-rate hardening (Dharmasena et al., 2008) can be used for simulation of the above cases with user subroutine VUHARD:
The material properties used by Dharmasena et al. and Rathbun et al. (2006) are as follows: Young's modulus of ![]() 2.00 × 10⁵ MPa, Poisson's ratio of
2.00 × 10⁵ MPa, Poisson's ratio of ![]() 0.30, density of
0.30, density of ![]() 7.85 × 10⁻⁹ metric tons/mm3, yield stress of
7.85 × 10⁻⁹ metric tons/mm3, yield stress of ![]() 300.0 MPa, tangent modulus of
300.0 MPa, tangent modulus of ![]() 2.00 × 10³ MPa,
2.00 × 10³ MPa, ![]() 4916 s–1, and
4916 s–1, and ![]() 0.154.
0.154.
In addition, the following approximate loading, which was applied on the sandwich structure described by Dharmasena et al., can be implemented with user subroutine VDLOAD:
![]()
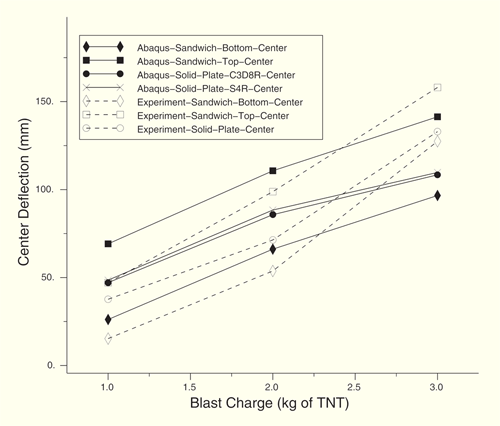
The Abaqus/Explicit results for the solid plate using the Johnson-Cook model for the steel alloy (Cases 1–6) are shown in Table 8.1.8–1. These results compare well with the experimental results reported by Dharmasena et al. (2008), shown in Table 8.1.8–2, for both the shell and continuum elements with CONWEP blast loading. The Abaqus/Explicit results for the sandwich structure compare within reasonable error with the experimental results. The simulation and experimental results are presented graphically in Figure 8.1.8–4. The solution differs significantly for higher loads, which Dharmasena et al. attribute to boundary conditions. At higher loads, it is likely that the edges of the sandwich panel used in the test arrangement were actually more flexible than the clamped condition used in the Abaqus model, causing differences between the numerical and experimental results. Differences in the results could also be due to debonding of the honeycomb core webs from the top and bottom plates in the experimental setup.
The sandwich structure was modeled for the same CONWEP loading with a different material model. An isotropic bilinear model with an atypical strain-rate hardening used user subroutine VUHARD with the material properties as described in “Additional cases” above. The displacements, shown in Table 8.1.8–3, were found to be much higher than the Johnson-Cook model and the experimental results, probably due to lower yield stress values.
In addition, the solid plate and the sandwich structure were modeled with the Johnson-Cook material model with an approximate loading, as described in “Additional cases” above, with user subroutine VDLOAD. The displacements, shown in Table 8.1.8–4, were found to be lower than the CONWEP blast loading and the experimental results, probably because less work was done on the model by the approximate load over the total time.
Solid plate model with S4R elements and 1 kg TNT blast load.
Solid plate model with S4R elements and 2 kg TNT blast load.
Solid plate model with S4R elements and 3 kg TNT blast load.
Solid plate model with C3D8R elements and 1 kg TNT blast load.
Solid plate model with C3D8R elements and 2 kg TNT blast load.
Solid plate model with C3D8R elements and 3 kg TNT blast load.
Sandwich structure model with 1 kg TNT blast load.
Sandwich structure model with 2 kg TNT blast load.
Sandwich structure model with 3 kg TNT blast load.
Sandwich structure model with user-defined material model and 1 kg TNT blast load.
User subroutine VUHARD with user-defined strain-rate hardening model.
Solid plate model with user-defined approximate loading equivalent to 1 kg TNT blast.
Sandwich structure model with user-defined approximate loading equivalent to 1 kg TNT blast.
User subroutine VDLOAD with the approximate loading equivalent to 1 kg TNT CONWEP blast load.
Dharmasena, K. P., H. N. G. Wadley, Z. Xue, and J. W. Hutchinson, “Mechanical Response of Metallic Honeycomb Sandwich Panel Structures to High-Intensity Dynamic Loading,” Journal of Impact Engineering, vol. 35, pp. 1063–1074, 2008.
Nahshon, K., M. G. Pontin, A. G. Evans, J. W. Hutchinson, and F. W. Zok, “Dynamic Shear Rupture of Steel Plates,” Journal of Mechanics of Materials and Structures, vol. 2–10, pp. 2049–2066, December 2007.
Rathbun, H. J., D. D. Radford, Z. Xue, M. Y. Hu, J. Yang, V. Deshpande, N. A. Fleck, J. W. Hutchinson, F. W. Zok, and A. G. Evans, “Dynamic Shear Rupture of Steel Plates,” International Journal of Solids and Structures, vol. 43, pp. 1746–1763, 2006.
Table 8.1.8–1 Center deflection computed by Abaqus/Explicit for Cases 1–9.
| Model | Charge mass | Center deflection (mm) | ||
|---|---|---|---|---|
| Top surface | Midsection | Bottom surface | ||
| Solid plate (S4R) | 1 kg TNT | – | 48.54 | – |
| 2 kg TNT | – | 88.38 | – | |
| 3 kg TNT | – | 109.75 | – | |
| Solid plate (C3D8R) | 1 kg TNT | – | 47.09 | – |
| 2 kg TNT | – | 85.72 | – | |
| 3 kg TNT | – | 108.38 | – | |
| Sandwich structure | 1 kg TNT | 69.15 | – | 26.15 |
| 2 kg TNT | 110.68 | – | 66.14 | |
| 3 kg TNT | 141.37 | – | 96.63 | |
Table 8.1.8–2 Center deflection measurements from experiments.
| Model | Charge mass | Center deflection (mm) | ||
|---|---|---|---|---|
| Top surface | Midsection | Bottom surface | ||
| Solid plate | 1 kg TNT | – | 37.65 | – |
| 2 kg TNT | – | 71.37 | – | |
| 3 kg TNT | – | 132.94 | – | |
| Sandwich structure | 1 kg TNT | 47.06 | – | 15.29 |
| 2 kg TNT | 98.82 | – | 53.73 | |
| 3 kg TNT | 158.04 | – | 127.45 | |