Product: Abaqus/CAE
Benefits: Abaqus/CAE now enables you to display shell geometry with its actual thickness during postprocessing. This enhancement provides a better representation of your analysis for models that contain shell geometry.
Description: You can now display the thickness of shell sections in your model by toggling on the Render shell thickness option. Shell thickness visualization is available in the Visualization module for all plot states.
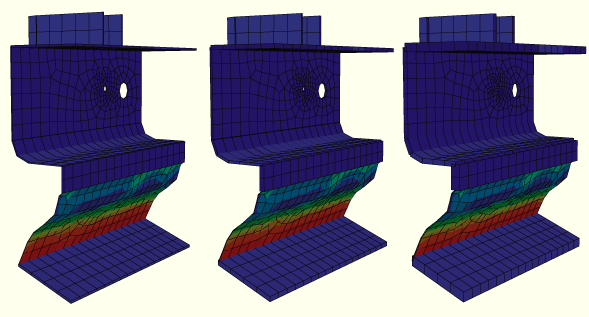
By default, Abaqus/CAE renders shell thickness at the scale specified in your model; however, you can change the Scale factor setting for shell thickness to increase or reduce the display of relative thickness for shell geometry. Figure 12–1 shows the effect of changing the shell thickness scale factor.
For contour plots, Abaqus/CAE displays shell sections with contour values that are based on the currently active section points. If the top section point or bottom section point is currently active, Abaqus/CAE displays the contour for that section point throughout the shell thickness; if both top and bottom section points are currently active, Abaqus/CAE creates a contour gradient through the shell thickness.
Visualization module:
View ODB Display Options: Render shell thickness and Scale factor