The toolbars contain convenient sets of tools for managing your files, filtering object selection, and viewing your model. Items in a toolbar are shortcuts to functions that are also available from the main menu bar. By default, Abaqus/CAE displays all of the toolbars in a row underneath the main menu bar. Abaqus/CAE may place some toolbars in a second row depending on your display resolution and the size of the main window. The toolbars are shown in the following figure:
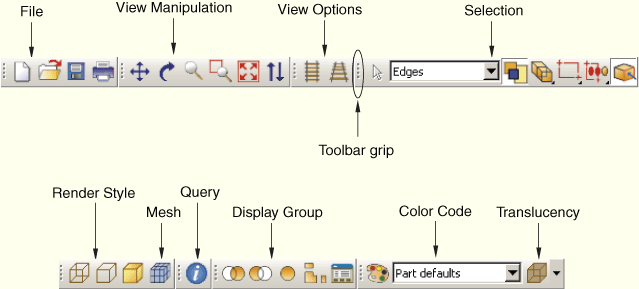
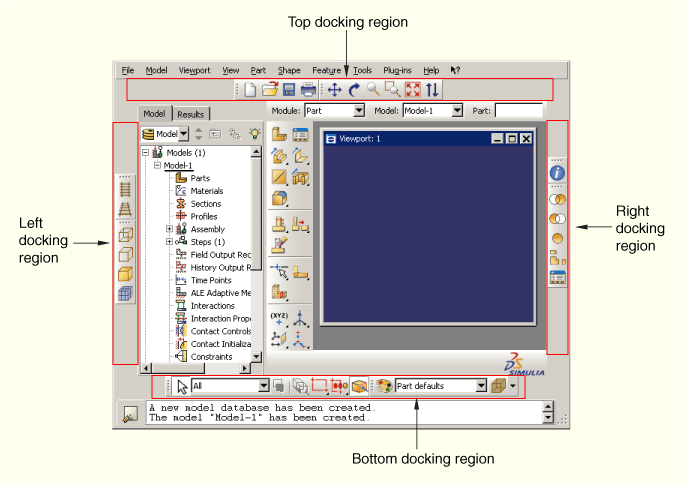
You can change the location of a toolbar using the toolbar's grip, as indicated in the above figure. Clicking and dragging the grip moves the toolbar around the main window. If you release the toolbar grip while the toolbar is over one of the four available docking regions of the main window (see Figure 2–2), Abaqus/CAE “docks” the toolbar; a docked toolbar has no title bar and does not obstruct any other portion of the main window.
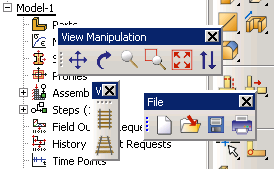
If you release the toolbar grip while the toolbar is not near a docking region, Abaqus/CAE creates a floating toolbar with a title bar. A floating toolbar obstructs other items in the main window (see Figure 2–3); however, a floating toolbar can be positioned outside of the Abaqus/CAE main window.
Clicking mouse button 3 on a toolbar grip displays a menu that lets you specify the location and format of the toolbar:
Select Top to dock the toolbar in the top docking region.
Select Bottom to dock the toolbar in the bottom docking region.
Select Left to dock the toolbar in the left docking region.
Select Right to dock the toolbar in the right docking region.
Select Float to change a docked toolbar into a floating toolbar; this option is available only for docked toolbars.
Select Flip to change the orientation of a floating toolbar from horizontal to vertical, or vice versa; this option is available only for floating toolbars.
You can also hide toolbars and create custom toolbars that include shortcuts to additional functions. For more information, see Chapter 58, “The Customize toolset.”
To obtain a short description of a tool in a toolbar, place the cursor over that tool for a moment; a small box containing a description, or “tooltip,” will appear. To obtain the name of a toolbar, place the cursor over the toolbar grip for a moment.
The Abaqus/CAE toolbars contain the following functionality:
File
![]()
View Manipulation
![]()
View Options
![]()
Render Style
![]()
Selection
![]()
Query
![]()
Display Group
![]()
Color Code
![]()
For color coding, you can create color mappings that assign unique colors to different elements of a display. For example, when using a part instance color mapping, each part instance in a model will appear as a different color. For more information, see Chapter 73, “Color coding geometry and mesh elements.”
For translucency, you can click the arrow to the right of the ![]() tool to reveal a slider, which you can drag to make the display colors more transparent or more opaque. For more information, see “Changing the translucency,” Section 73.3.
tool to reveal a slider, which you can drag to make the display colors more transparent or more opaque. For more information, see “Changing the translucency,” Section 73.3.
Field Output
![]()
Viewport
![]()
The Viewport toolbar allows you to create and align viewports, link viewports, and create viewport annotations. For more information, see “Managing viewports and viewport annotations from the Viewport toolbar,” Section 4.2.2. The Viewport toolbar is not displayed by default.
Views
![]()