Product: Abaqus/Standard
This example verifies and illustrates the use of the extended finite element method (XFEM) in Abaqus/Standard to predict dynamic crack propagation of a plate with an edge crack. The specimen is subjected to a high rate shear impact loading. The crack paths and crack initiation angles presented are compared to the experimental results of Kalthoff and Winkler (1987).
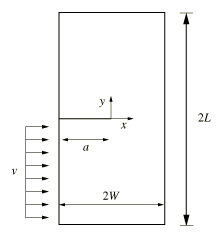
A plate with a single edge crack is studied. The specimen, shown in Figure 1.19.41, has dimensions L = 0.003 m and W = 0.0015 m and an initial crack with length a = 0.0015 m. The lower part of the specimen is subjected to an impulse load along the horizontal direction, which is modeled as a prescribed velocity:
![]()
The material data for the bulk material properties in the enriched elements are ![]() = 3.24 GPa,
= 3.24 GPa, ![]() = 1190 kg/m3, and
= 1190 kg/m3, and ![]() = 0.35.
= 0.35.
The response of cohesive behavior in the enriched elements in the model is specified. The maximum principal stress failure criterion is selected for damage initiation, and an energy-based damage evolution law based on a power law fracture criterion is selected for damage propagation. The relevant material data are as follows: ![]() = 100.0 MPa,
= 100.0 MPa, ![]() = 700 N/m,
= 700 N/m, ![]() = 700 N/m,
= 700 N/m, ![]() = 700 N/m,
= 700 N/m, ![]() = 1.0,
= 1.0, ![]() = 1.0, and
= 1.0, and ![]() = 1.0.
= 1.0.
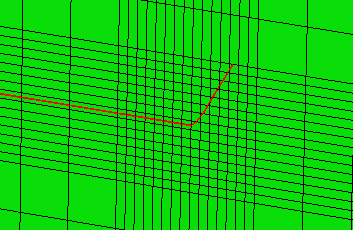
Figure 1.19.42 shows the crack profile when ![]() = 6.0 × 10⁻⁶ s. The crack propagates at an angle of 62°, which is in reasonable agreement with the experimental result of 65°.
= 6.0 × 10⁻⁶ s. The crack propagates at an angle of 62°, which is in reasonable agreement with the experimental result of 65°.
Three-dimensional brick model with reduced integration under shear impact loading.
Script to generate the three-dimensional brick model with reduced integration under shear impact loading in Abaqus/CAE simulated using the XFEM-based cohesive segments approach.