Product: Abaqus/CAE
Benefits: You can now plot contours to display field output in the beam cross-sections in your model. This enhancement provides a more realistic depiction of analysis results for beam geometry.
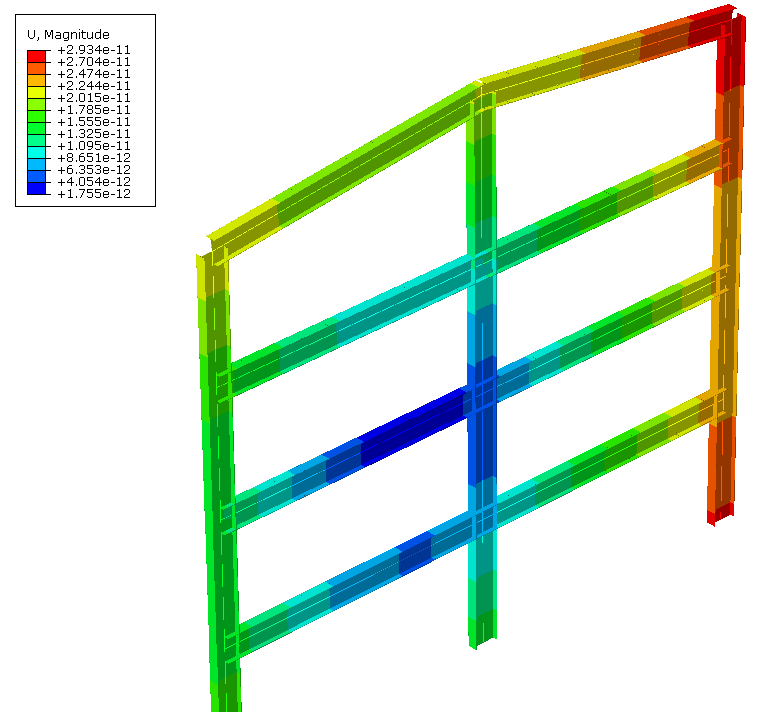
Description: You can now enable beam rendering for a contour plot, which allows you to visualize field output as contours in beam geometry. For nodal output variables and element integration point output variables, Abaqus/CAE creates contour plots with results that are constant through the cross-section of the beam, as shown in the I-beams in Figure 131. Contour plots of element integration point data show data for a single section point through the entire thickness of the beam.
Figure 131 Beam contours displayed for displacement, a nodal output variable, on several I-beams in a model of a building.
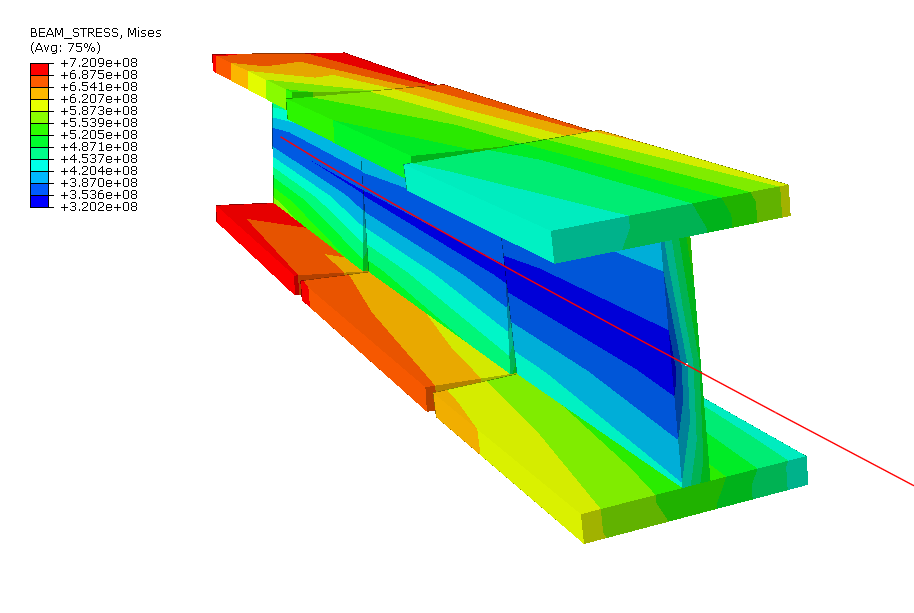
Stress visualization in beams provides an additional level of realism, because you can now plot contours that depict the variations in stress throughout the beam. The beam stress contour plot uses linear elastic theory to compute values at critical corners of the cross-section based on the element integration point quantities SF (section force) and SM (section moment). Abaqus/CAE then interpolates these values within the beam cross-section. Selecting the new BEAM_STRESS output variable enables you to show these interpolated beam stress values in a contour plot, as shown in the close-up of I-beam geometry in Figure 132. The BEAM_STRESS output variable is available for use only if the current step and frame includes results from the element integration point variables SF and SM.
You can create contour plots of beam stress for seven types of beam profiles: box, pipe, rectangle, circle, I-beam, L-beam, and T-beam.
Visualization module:
Result Field Output: Primary Variable tabbed page: BEAM_STRESS