Products: Abaqus/CFD Abaqus/CAE
Benefits: You can now visualize the velocity or vorticity of fluid flow in an Abaqus/CFD analysis using streamlines, which trace the path that massless particles travel in a fluid flow analysis. This enhancement expands the visualization capabilities of Abaqus/CAE for fluid-structure interaction analyses.
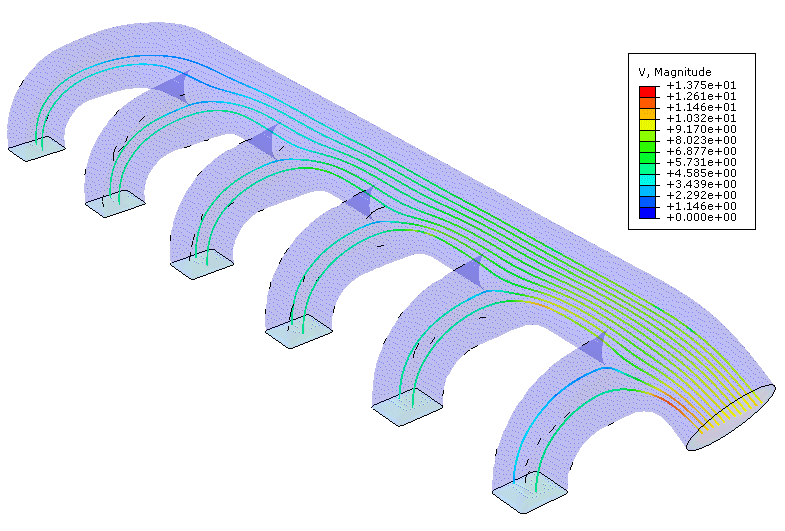
Description: The new Stream toolset enables you to visualize fluid flow data by placing a “rake” into the flow. A rake is a line segment or series of line segments with a number of points specified along its length; Abaqus/CAE traces streamlines to display the flow passing through each point on the rake. Figure 133 displays the streamlines that show fluid flow downstream from a twelve-pointed stream rake placed at the inflow duct of a manifold.
You can define the rake you want to use by defining a line segment or by specifying a path definition. If you want to use a line segment for your stream rake, you can either pick starting and ending nodes from the viewport or enter the global coordinates for the points you want to use.The Stream Manager enables you to display or hide multiple stream definitions in the viewport; and for each stream, you can display flow data upstream from the rake location, downstream from the rake location, or in both directions.
You can also customize the color and thickness of streamlines in the current viewport. Streamlines can be displayed with a uniform color or by using a contour spectrum that matches the current primary field output variable. If you display streamlines with contours, you can choose between a banded contour spectrum or a continuous spectrum. In addition, you can add arrows to the streamlines that indicate the direction of fluid flow, and you can increase or decrease the number of arrows to clarify their display.
Streamlines display flow data for the currently selected stream variable, which you can control from the new Stream Variable tabbed page in the Field Output dialog box. Most flow analyses include both velocity and vorticity data.
Visualization module:
Tools Stream
ResultField Output: Stream Variable tabbed page
Stream
ResultField Output: Stream Variable tabbed page